| Borrelli, Jeremy R. | 2015 | The Bay of Storms and Tavern of the Seas Risk in the Maritime Cultural Landscape of the Harbor at Cape Town, South Africa |
Utiling ArcGIS and images of the contemporary and historic shoreline, Borrelli reconstructed the maritime cultural landscape of Cape Town at different decades of the 19th century. In doing so, Borrelli found that the harbor changed as a result of the several shipping risks that previously impeded its growth. The harbor became larger in comparison to the small business of the early 19th century into larger private interests which wished to mitigate risk and growing the harbor.
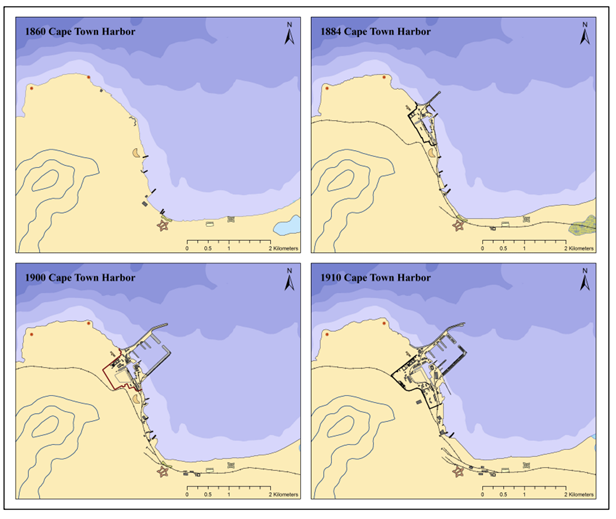
harbor works, extent of harbor property and supplementary infrastructure utilized by the
maritime community (Borrelli 2015:149)
| Sanchagrin, Stephen in Bright, John | 2012 | The Last Ambush: An Adapted Battlefield Analysis of the U-576 Attack Upon Allied Convoy KS-520 Off Cape Hatteras During the Second World War |
Bright applied military science techniques and KOCOA to analyze the tactics and routes of both U-576 and KS-520 as well as their view shed. Sanchagrin visualized the battlefield’s viewsheds from both vessels as well as USN Patrol Aircraft. Included in that was a reconstruction of U-576 as it peered over the water.
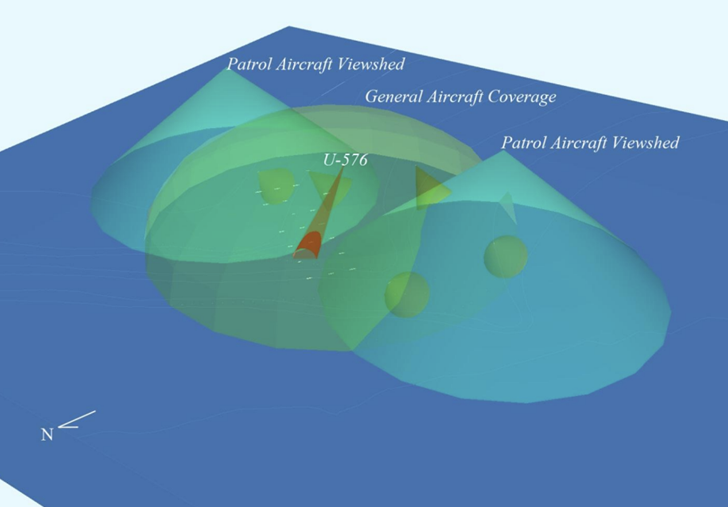
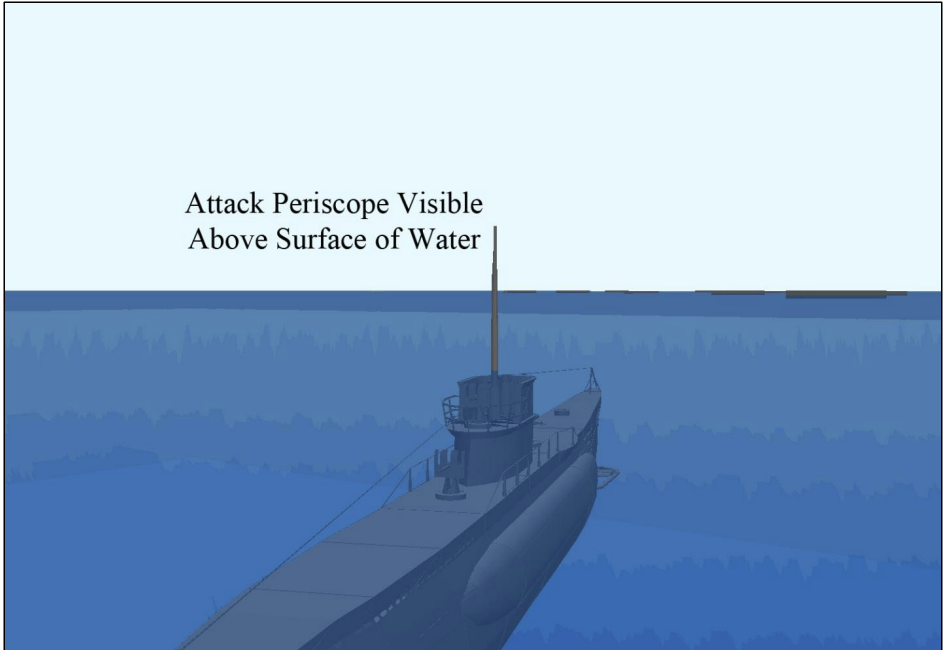
KS-520 (Bright 2012:250)
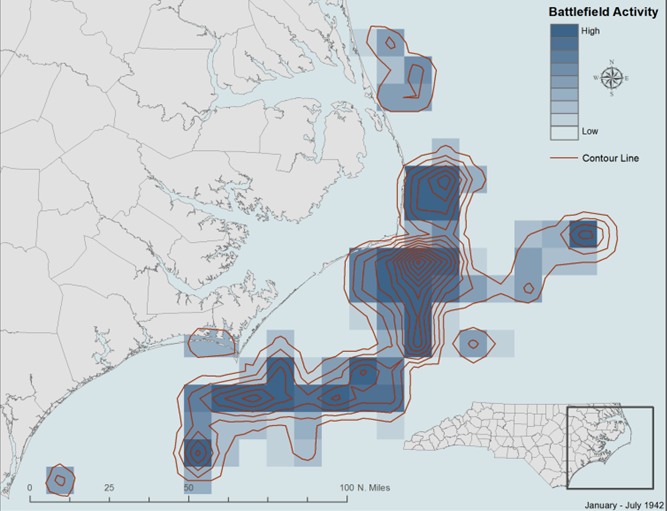
| Sanchagrin, Stephen | 2014 | A View Through the Periscope: Advanced Geospatial Visualizations of Naval Battlefields of the Second World War |
Sanchagrin utilized GIS to map naval battlefields activity off of North Carolina. FIGURE 3 shows cumulative activity during the whole duration of the war but Sanchagrin also created an animation of the rate of battlefield activity for different months, showing the changing naval lines of the World War II.
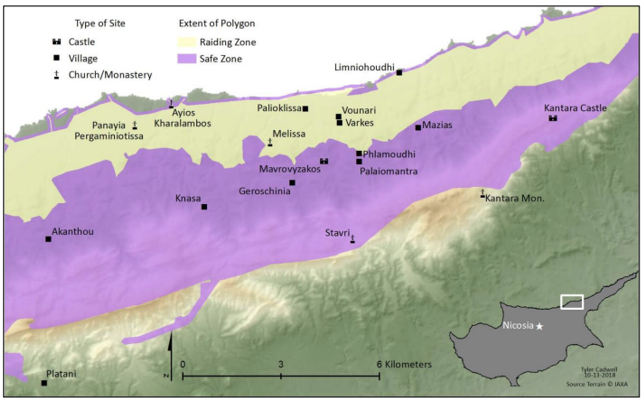
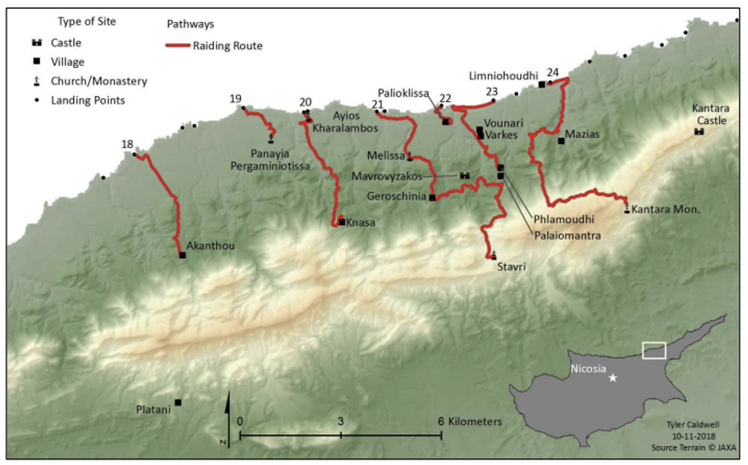
| Caldwell, Tyler Martin | 2019 | Defend Your Coast: Network Analysis of Crusader Fortifications and Settlements in the Kyrenia Region of Cyprus |
Caldwell visually recorded the fortifications of Cyprus in the Crusading Period to map the extent a raiding party could venture into Cyprus. FIGURE 4.1 displays the proposed safe zone which includes more fortifications and harsher topography for raiders, while the raiding zone shows areas more susceptible to invaders. FIGURE 4.2 shows the historic raiding pathways, which at times were correlated to actions in the Raiding Zone, but some parties would venture deep in the safe zone.
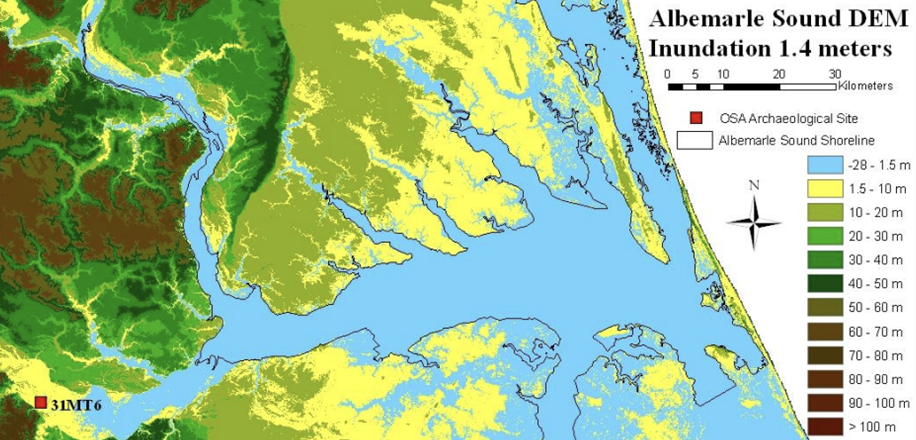
| Hayman, Jeanette | 2011 | Heritage at Risk? An Assessment of Environmental Factors in Archaeological Site Damage in Albemarle Sound, North Carolina |
Hayman studied the effects of “waves derived from wind, shoreline erosion, sediment accumulation, and inundation from sea-level rise” along the Albemarle Sound (i). To do this, Hayman studied DEM data, bathymetry, and environmental sensitivity on OSA sites using ArcGIS ArcMap 9.3 to determine the future risk of those sites.
| Knutson, Janie Rose | 2018 | “War is War, and I Must Carry Out My Duty”: A Geospatial and Statistical Analysis of North Carolina’s First World War Battlescape |
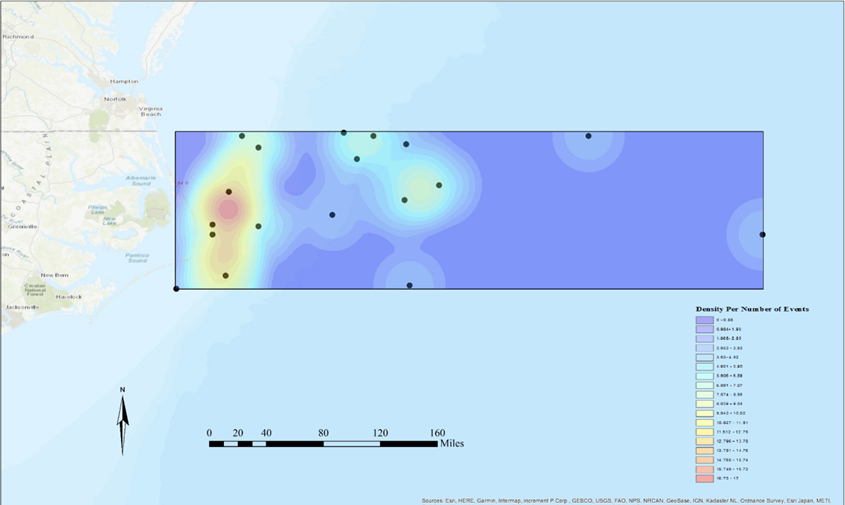
Knutson studied the battlescape of North Carolina in World War I. One element of their thesis was mapping the operations of U-Boats off the coast of North Carolina and using spatial analyst tools of ArcGIS including Kernel Density and Convex hull to map a potential battlescape of U-Boat operations .
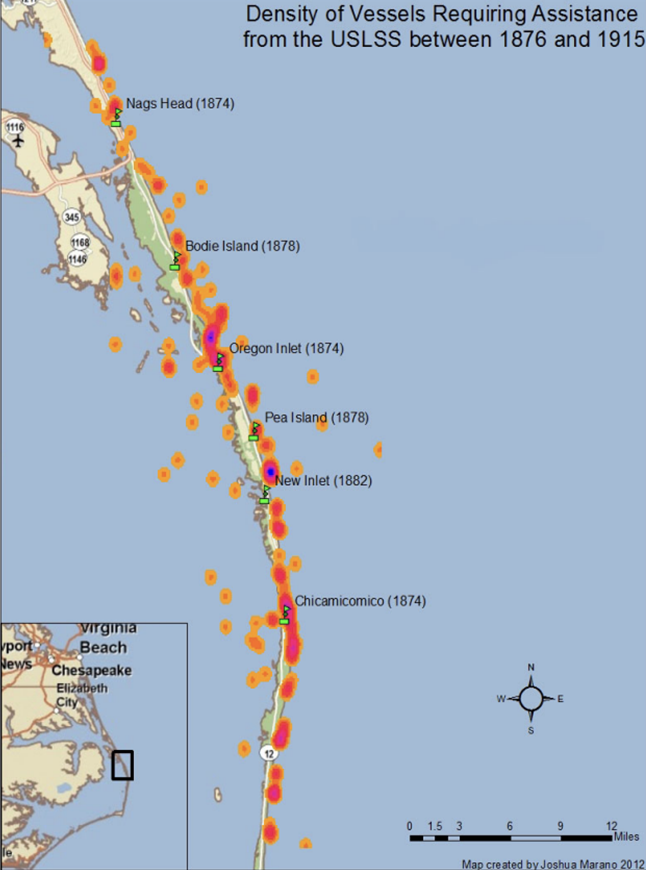
| Marano, Joshua | 2012 | Ship Ashore! The Role of Risk in the Development of the United States Life-Saving Service. |
Marano studied the USLSS’s affect on the riskscape, a cultural landscape focused on shipwrecking, of the Outer Banks. To this, Marano examined the construction of USLSS on the research area and the resulting affects on wrecking activity with maps made from ArcGIS, see FIGURE 7.
| Rose, Scott | 2017 | Illuminating the Lighthouse: An Historical and Archaeological Examination of the Causes and Consequences of Economic and Social Change at the Currituck Beach Light Station. |
Combining Gradiometry, Magnetometry and ArcGIS with historical data and imagery, Rose analyzed the change in landscape features and areas of potential deposits on the Currituck Lighthouse. The noted deposits were spatially correlated to the building and removal of temporary structures like a blacksmith shop in the 19th century and a barracks in 20th century.
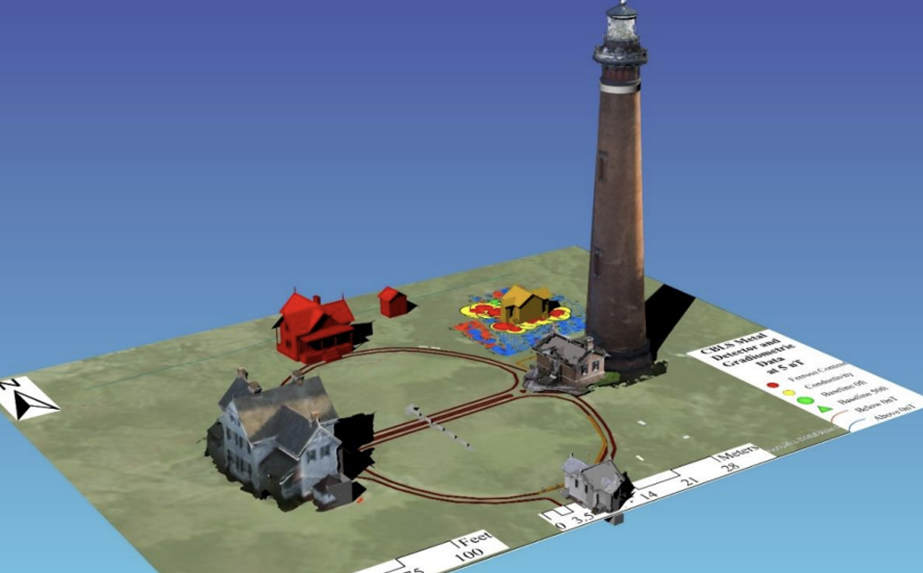
north storage shed to the east and the newly arrived small keeper’s house and outhouse. (B. Scott
Rose 2017: 136)
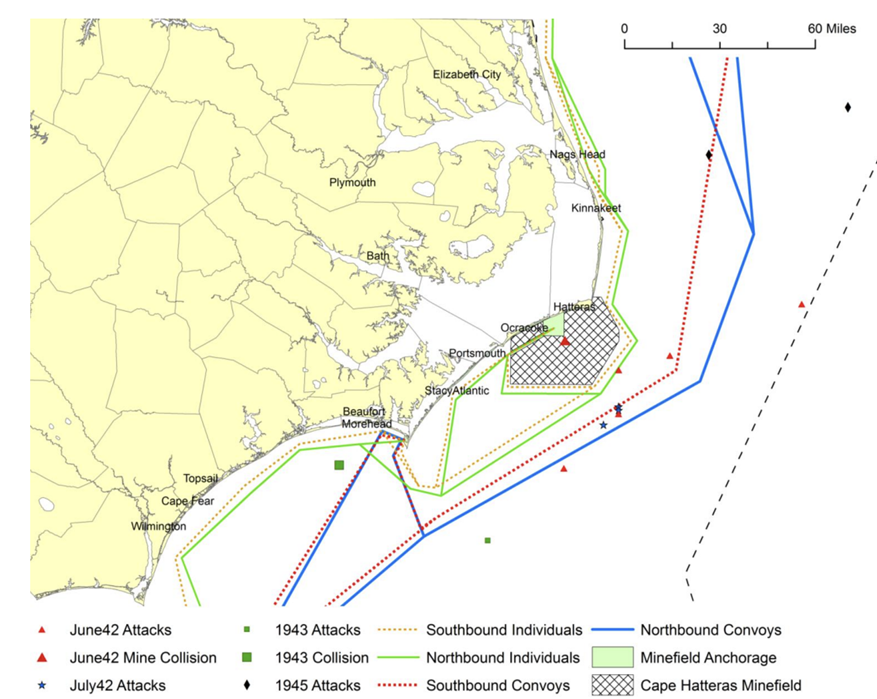
| Wagner, John | 2010 | Waves of Carnage: A Historical, Archaeological, and Geographical Study of the Battle of the Atlantic in North Carolina Waters. |
Using ArcGIS , Wagner attempted to construct the borders for the Battle of the Atlantic as it existed in North Carolina. Included in the data were convoys, wrecks from Torpedo Alley, and the confines of the Cape Hatteras Minefield to construct what the boundaries of the conflict looked like.