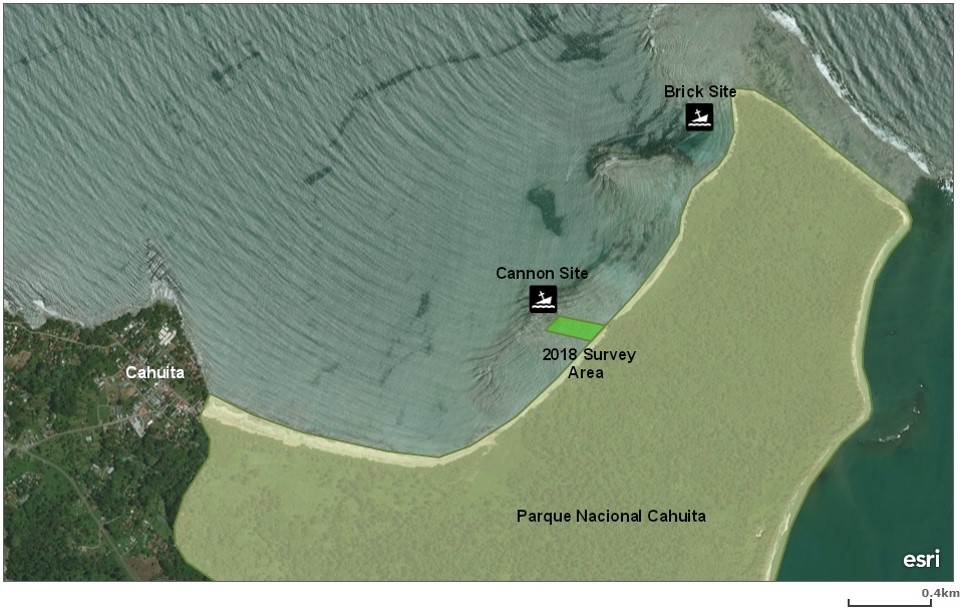
Students and professors of East Carolina University’s Maritime Studies program conducted the Fieldwork for this project in September and October of 2018. The site inspection of this area is part of a continuing project that is looking at the material remains of a ship located off of Cauhita Point in Cauhita National Park. The site that was inspected this year was chosen because of the results of surveys done near this location in the past few years.
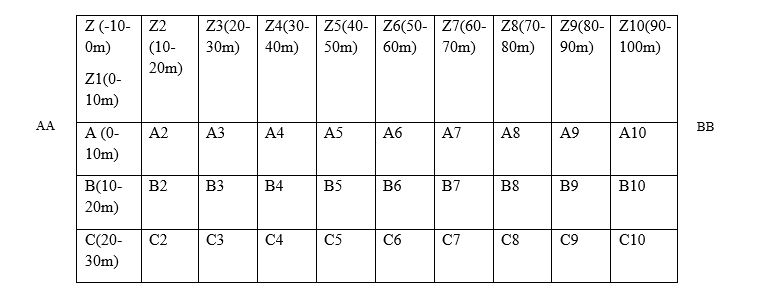
The survey area was 200 meters by 100 meters. This distance started about ten meters from the high tide mark on the beach and was parallel to the shore. The team designated the area on a computer map. GPS points were taken and used to locate where the corners of the Survey area should be. The corners of the survey area were marked with Sand bags. The sand bags were used because they would not effect of the ecosystem of the national park. To help with this purpose, some of the sand bags were filled with sand that was from National Park. The other sand bags were filled with sand from Playa Negra, a beach separate from the park. This was done because the permit for the team to do their work was active until October 1, so the survey team was not able to use the sand in the National Park.
These sand bags were placed at the coordinates of the survey area and logged in as Points A, B, C, and D. The original plan was to use the polypro to outline the site and attach tags every ten meters to mark the grid areas. Due to the shortage of polypro line, the outline of the survey area could not be outlined with rope. To combat this, the decision was made to make more sand bags, attach them to buoys and move them with the baselines to the rows that were being surveyed during the day. These bags were placed in line with the survey corners based on line of sight and compass bearings. At the beginning of each day, team members would move to the lanes that would be surveyed. The sand bags on both sides would be placed twenty meters away from the previous sandbag, in the same compass bearing to make sure the borders were kept consistent. The bag was moved twenty meters to lessen the amount of sand bags and baselines needed. A team member would stand over the sand bag on the northeastern side while holding the zero end of a 100 meter tape. Another team member would take the 100 meter tape and swim towards the southwestern side. Team members would be placed at the 25m, 50m, and 75m when the tape was stretched out and used to help the tape become straight while the two sand bags at either end of the baseline were set. Once the baseline was set, the tapes would be clipped and tucked under the sandbags so line movement would be minimum.
Each ten meter row was given a designation. The first row, 0-10m, was row A, 10-20m was row B, 20-30m was row C, and so on. The only difference to the system was row Z. To be thorough in the survey, ten meters behind the zero meter mark was surveyed and it was marked row Z.
Two team members surveyed each grid square. At the beginning of each day, during the morning briefing, the teams would be assigned two or more grid squares to survey. After the morning briefing, each pair would swim out to their assigned grid and conduct their survey. The common procedure to conduct the survey was for one team member to stand on the baseline with the slate and the tape while the other one would swim straight out to ten meters. At that point, the team member on the baseline signaled the swimmer that that they had reached ten meters. Then both team members would move over one meter and the team member on the baseline would reel in the swimmer. Once the swimmer had returned to the baseline, the process would start again after moving over one meter. The swimmer would scan the area while swimming. The visibility of the water permitted the range between the swim lines because the visibility was usually about 3-4 meters on each side.
Another method that was used was both team members would swim parallel to the base line, holding the tape between the two of them. During the first sweep, the tape would be reeled out to three meters and the pair would swim from zero end of the grid square to the ten meter mark. Then the tape would be moved to cover three meters to six meters and the pair would swim back to the zero meter mark. The process would be repeated from six to nine meters, after which the grid would be finished.
When an artifact was found, its location was marked with baseline and offset measurements, photo number, comment, and identification number. When located, the swimmer communicated to their team member to stop and take the offset measurements, while they held the dumb end of the tape in the center of the object. Then, the swimmer would correctly place the north arrow to take a picture and take measurement of the artifact when necessary. When finished, the swimmer would communicate to their buddy that they were continuing. Nonverbal communication between team members consisted of a series of tugs on the measuring tape. Before they started their grid squares for the day, each team would determine their specific form of communication. While the tug system varied between teams in the beginning of the project, a specific system became the most widely accepted form. This system consisted of three tugs for an artifact found, two tugs for reaching the end of the ten-meter grid, and two tugs when the swimmer is again parallel to their team member along the baseline. A large portion of the survey was done on snorkel, so communicating what the object was and its measurements could be done verbally. When on SCUBA, oftentimes the recorder would set the tape down and swim to where the artifact was to record its identification, measurements, and photo number. Again, this could vary between groups. If an artifact was considered to be diagnostic or of greater importance, the team member who was in charge of the GPS would come over and take a GPS point. Then they bring the object to the surface to take more in-depth photographs. The process would repeated until the assigned grids were finished. At that point, more grids were assigned.
A mix of SCUBA and snorkeling were used during the course of the project. In the beginning, SCUBA was used but after a few days, the teams switched to snorkel. The switch occurred because the SCUBA gear proved to be more cumbersome in the shallow depth that the team was working in. It also proved to speed up the process of surveying due to the fewer number of items that needed to be transported to the survey grids.
The limitations that were encountered with using this survey method were due to the surge which would cause minor movement in the baseline and to the students. This surged could cause small errors in the recording of the measurements. Another limitation was based on the swimmer. It was difficult for the swimmer to swim in a 90 degree angle from the baseline. To help account for any error, the team member on the baseline would try and signal the swimmer if they were off and bring them back to 90 degrees. The visibility also helped combat this problem because even if the swimmer was off of 90 degrees, they would be able to see the full area clearly.
When work in the field would wrap up, all the gear (except for what was anchored to the sea floor) was packed up, loaded onto the boats, and everyone would ride back to the boat launch. Each day the students would unload the boats while they were still in the water, and then help the boat captain haul the boats out of the water. Gear was then rinsed and put away, and slates with used mylar was brought back to the hotel. The team then had a free period lasted until mid-afternoon. When post processing began, the data that was written down on mylar sheets was transcribed into field notebooks, an Excel spreadsheet, and a hard copy of the spreadsheet. The students with 200:1 scaled ratio formed a site map; and each pair would take turns plotting their points for the day. The measurements were scaled down to centimeters, so each original measurement taken had to be multiplied by 100 and then divided by 200 to equal out to the distance measured along the site map. Any photos taken during day were downloaded on to a dedicated communal external hard drive and labeled with team member’s initials and the date. After the photos were downloaded, the camera’s memory cards were wiped clean in preparation for the next day. At the end of post processing, all digital data was saved on to the hard drive.