UNDER CONSTRUCTION
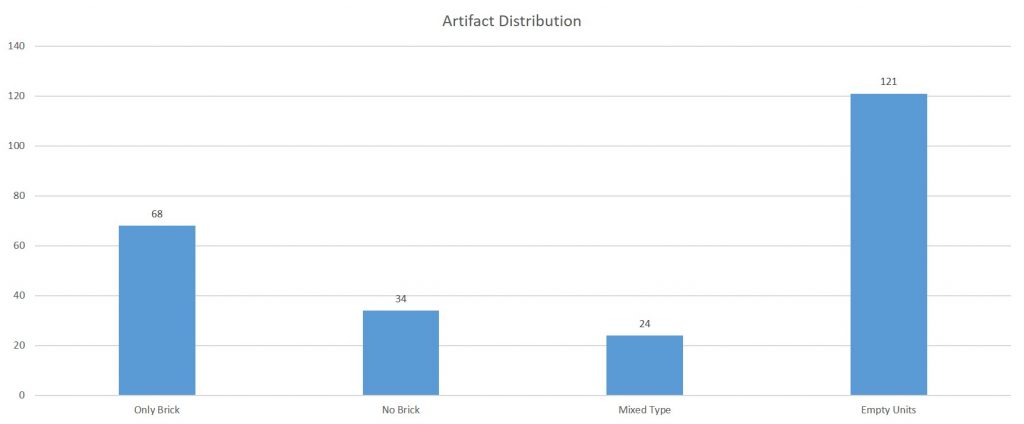
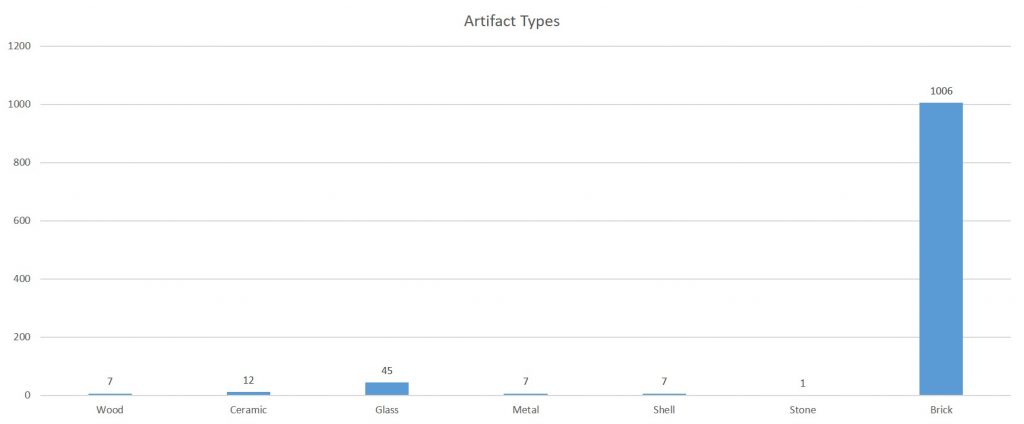
The two graphs featured above explain the artifact distribution of through the survey area. The first graph shows the numbers of units that contianed artifacts and how many had bricks, no bricks, a mix of bricks and other artifacts and empty units. The second graph examines the number of total artifacts found in the survey area. The artifacts are separated into 7 categories: wood, ceramic, glass, metal, shell, stone, and brick.
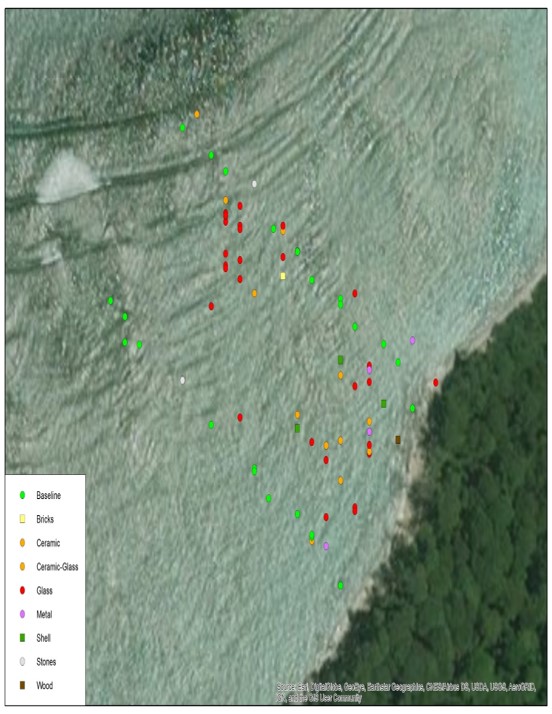
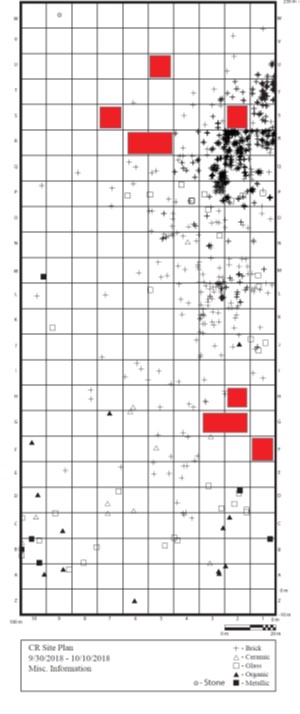
The two maps above show the distribution of artifacts through the survey area. The first map shows the locations of the artifacts on a map of the area from Google Earth. The second map portrays the artifact distribution inside the survey area. The red boxes represent empty units.